Statistics Project
For this project, we created a question that we used as a survey around our school. This question had to give quantitative data, or numbers. An example is rate your favorite ____, from 1-5. The question that I cam up with was rate music genres from 1-10 depending on how often you listen to that genre of music. The genres I used were Alternative, rap, rock, classical, dance, pop, jazz, and country. The reason I chose this question is because I thought it sounded fun to ask people and I was interested in it. I am hoping to find that everyone should have our own music preference and that you should judge people for how old they are to affect their personal music preference. Some predictions I have made would be that I think alot of people will rate alternative highly and classical low because many people my age usually listen to things like that.
So now that I have my question, I can decide how to collect data: a specific sampling method. The sampling method that I chose was convenience sampling. This method means that you can give it to a group of people that it is convenient to give to. I chose this method because well, it is convenient. I chose to hand out my question on slips of paper to my grade because it was helpful. My experiences when giving out my survey were pretty good, I handed out slips of paper, and just waited around until they were done answering the question and then collected their answers. Some advantages with this sampling method is that it is easy to collect data because I can just get my classmates to fill out the survey, and everyone is the same age. Some disadvantages that you can get with this sampling method is that a lot of people will have the same answers because we have most of the same music tastes.
So now I have found out the information and standard deviation of my results. I had 8 genres that people rated, but my partner and I split up the genres so I will only be presenting 4 of those genres.
Range: Mean: Median: Mode:
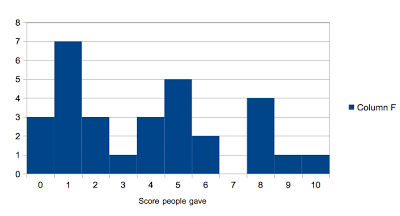
Dance: 0-10 Dance: 4.4 Dance: 5 Dance: 5
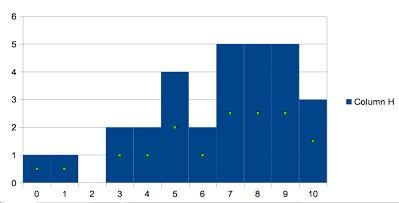
Pop: 0-10 Pop: 6.6 Pop: 7 Pop: 7, 8 &9
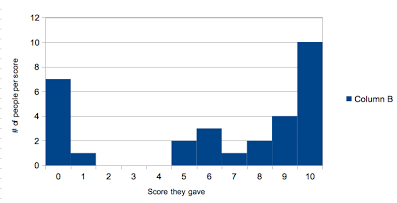
Alternative: 0-10 Alternative: 6.3 Alternative: 8 Alternative: 10
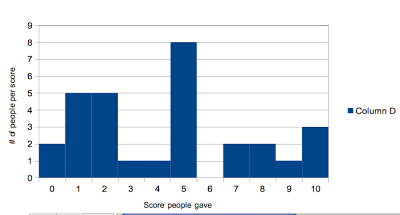
Classical: 0-10 Classical: 3.9 Classical: 4 Classical: 1
Standard Deviation:
Alternative: 3.74
Classical: 3
First what I have noticed is that all of my graphs are not the typical bell curve. They actually look pretty weird. I did not sort them into genders and I also didn't notice anything really about my data. It sort of came out how I expected it to. They match my hypothesis because I thought that the Classical bell curve would come out weighted at the low numbers and empty with the higher numbers. That sort of happened. The pop also came out how I thought it would. It is weighed more at the higher numbers. It is possible that there could have been errors, but I am not sure what they would affect and what they would come from. I suppose that the result of rounding numbers when solving the standard deviation could affect the outcome, but that is the only thing I can think of.
After creating these graphs, my partner and I compared each other;s data. The only issue with this was that we each picked four different music genres each, so we took each other's data and repeated the same process as before on the same genres with our partner's data. Now that I have done this, I can compare our data. The data for my partner's was this:
Range: Mean: Median: Mode:
Alternative: 0-10 Alternative: 4.7 Alternative: 4.5 Alternative: 3
Classical: 0-10 Classical: 4.6 Classical: 4 Classical: 4
Dance: 0-10 Dance: 4.1 Dance: 3 Dance: 0
Pop: 0-10 Pop: 2.8 Pop: 1.5 Pop: 0
Some of the differences between our data is that first: my data for Alternative the mode is ten, my partner's is 3. I think this is because my group of people I asked was my age and Alternative is very popular in this age group, and not so much with random sampling where my partner asked all ages. Another difference was that in my data the mode for Pop was pretty high, but in the other data the mode is zero. All of the ranges were the same for all of the data, as well as the mean of the Dance genres were pretty close to each other.
Something far apart was the median of Alternative and Pop. So as you can see, some things are really far apart, but some are almost the same. I think that the factors that changed each other's data would be the sampling method because we chose different age groups.
So now that I have my question, I can decide how to collect data: a specific sampling method. The sampling method that I chose was convenience sampling. This method means that you can give it to a group of people that it is convenient to give to. I chose this method because well, it is convenient. I chose to hand out my question on slips of paper to my grade because it was helpful. My experiences when giving out my survey were pretty good, I handed out slips of paper, and just waited around until they were done answering the question and then collected their answers. Some advantages with this sampling method is that it is easy to collect data because I can just get my classmates to fill out the survey, and everyone is the same age. Some disadvantages that you can get with this sampling method is that a lot of people will have the same answers because we have most of the same music tastes.
So now I have found out the information and standard deviation of my results. I had 8 genres that people rated, but my partner and I split up the genres so I will only be presenting 4 of those genres.
Range: Mean: Median: Mode:
Dance: 0-10 Dance: 4.4 Dance: 5 Dance: 5
Pop: 0-10 Pop: 6.6 Pop: 7 Pop: 7, 8 &9
Alternative: 0-10 Alternative: 6.3 Alternative: 8 Alternative: 10
Classical: 0-10 Classical: 3.9 Classical: 4 Classical: 1
Standard Deviation:
Alternative: 3.74
Classical: 3
First what I have noticed is that all of my graphs are not the typical bell curve. They actually look pretty weird. I did not sort them into genders and I also didn't notice anything really about my data. It sort of came out how I expected it to. They match my hypothesis because I thought that the Classical bell curve would come out weighted at the low numbers and empty with the higher numbers. That sort of happened. The pop also came out how I thought it would. It is weighed more at the higher numbers. It is possible that there could have been errors, but I am not sure what they would affect and what they would come from. I suppose that the result of rounding numbers when solving the standard deviation could affect the outcome, but that is the only thing I can think of.
After creating these graphs, my partner and I compared each other;s data. The only issue with this was that we each picked four different music genres each, so we took each other's data and repeated the same process as before on the same genres with our partner's data. Now that I have done this, I can compare our data. The data for my partner's was this:
Range: Mean: Median: Mode:
Alternative: 0-10 Alternative: 4.7 Alternative: 4.5 Alternative: 3
Classical: 0-10 Classical: 4.6 Classical: 4 Classical: 4
Dance: 0-10 Dance: 4.1 Dance: 3 Dance: 0
Pop: 0-10 Pop: 2.8 Pop: 1.5 Pop: 0
Some of the differences between our data is that first: my data for Alternative the mode is ten, my partner's is 3. I think this is because my group of people I asked was my age and Alternative is very popular in this age group, and not so much with random sampling where my partner asked all ages. Another difference was that in my data the mode for Pop was pretty high, but in the other data the mode is zero. All of the ranges were the same for all of the data, as well as the mean of the Dance genres were pretty close to each other.
Something far apart was the median of Alternative and Pop. So as you can see, some things are really far apart, but some are almost the same. I think that the factors that changed each other's data would be the sampling method because we chose different age groups.
|
Alternative Bell Curve:
|
Classical Bell Curve
|
|
|
|
Dance Bell Curve:
|
Pop Bell Curve
|
